Why Odoo database performance degrades over time and what to do about it
As your Odoo database grows more records, more transactions, more users query performance gradually deteriorates without active maintenance. Dead tuples accumulate in tables after updates and deletions, consuming disk space and forcing PostgreSQL to scan through data it no longer needs. Tables become fragmented and bloated. Indexes fall out of alignment with actual data distribution. Slow-running operations pile up undetected, quietly adding latency to every user interaction. In a busy Odoo deployment, the result is familiar: pages that used to load instantly now take several seconds, reports that ran quickly now time out, and operations that should be seamless feel sluggish.
PostgreSQL provides the tools to fix this VACUUM, REINDEX, bloat analysis, slow query detection but running them requires technical knowledge, manual access to the database, and consistent scheduling discipline that most teams simply do not have. The Database Performance Optimizer module by Creyox brings all of this directly into Odoo. It automates the full optimisation cycle on a configurable schedule, surfaces slow queries and bloated tables in a readable interface, and gives administrators a manual trigger for on-demand optimisation all without leaving Odoo or touching the database server directly.
Overview
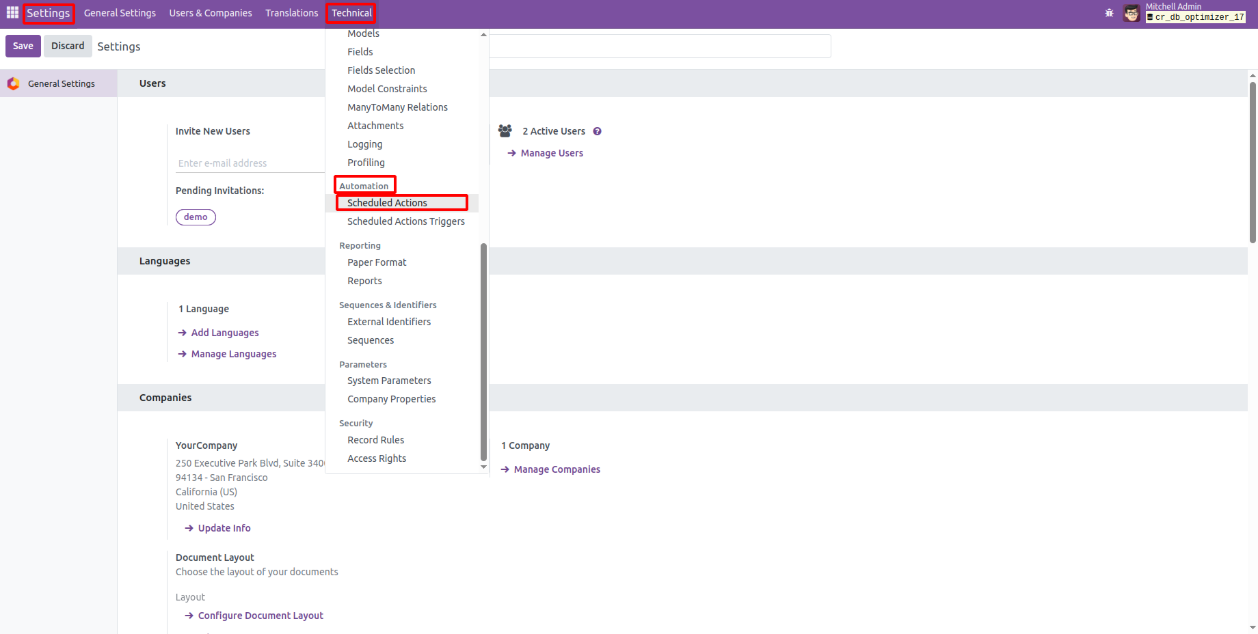
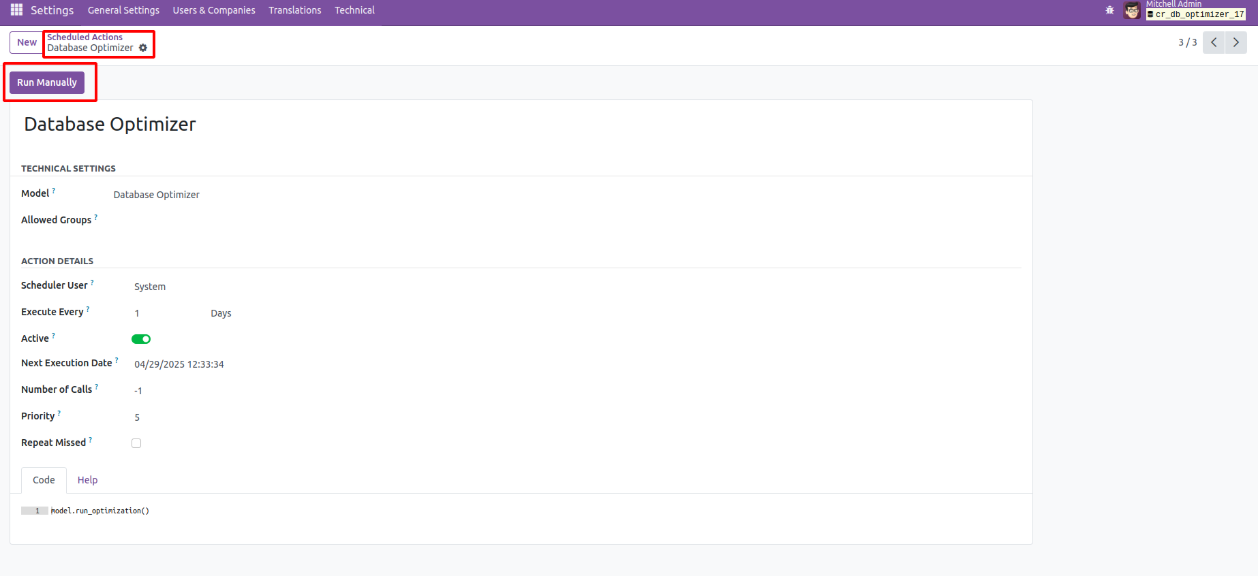
The Creyox Database Performance Optimizer extends Odoo 18.0 with an automated database maintenance engine built around PostgreSQL's native optimisation capabilities. Once installed, the module adds a dedicated Scheduled Action Database Optimizer accessible from Settings → Technical → Automation → Scheduled Actions. Administrators set the Execute Every interval to define how often the optimisation cycle runs automatically. The Next Execution Date updates accordingly, and at each scheduled interval the module runs five maintenance operations: VACUUM (removes dead tuples and reclaims disk space), REINDEX (rebuilds indexes for better query performance), Bloated Table detection (identifies tables consuming the most storage), Slow Query analysis (surfaces the slowest-running operations in the system), and Active DB Connection checking.
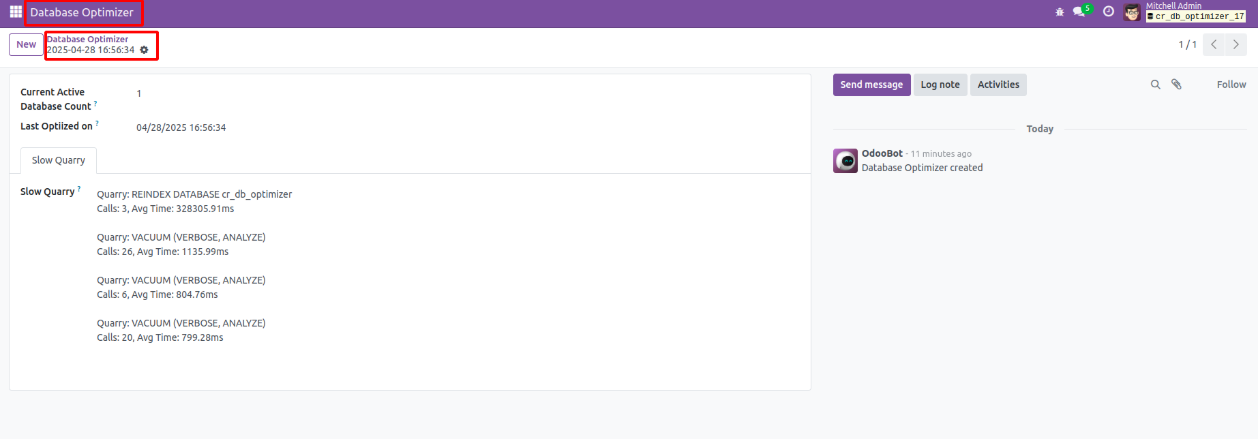
Each completed optimisation cycle creates a record in the Database Optimizer menu, where administrators can review the Current Active Database Connection count, the Last Optimized On timestamp, and the list of Slow Queries identified during that cycle. For immediate needs, the Run Manually button on the Scheduled Action record triggers the full optimisation process on demand and shows real-time logs of the operation as it runs. No database server access, no SQL commands, and no external tooling required.
Hot Features
◆ Database optimization schedule action
◆ Boost the database execution
◆ Auto & Manual optimization process
Advantages Of Database Optimizer
◆ Reclaims Disk Space: Removes dead tuples and frees up unused space, reducing database size.
◆ Improves Query Performance: By cleaning and compacting tables, queries run faster with less I/O.
◆ Detects Storage Inefficiencies: Quickly identifies which tables have the highest storage consumed.
◆ Identifies Operation that make process slow: Highlights the slowest-running operation in the system.
◆ Database Resource Efficiency: Reduces CPU, memory, and disk usage by making expensive operation faster.
Work Flow Of Database Optimizer
- User need to navigate to Settings >> Technical >> under Automation Schedule Action and select user.
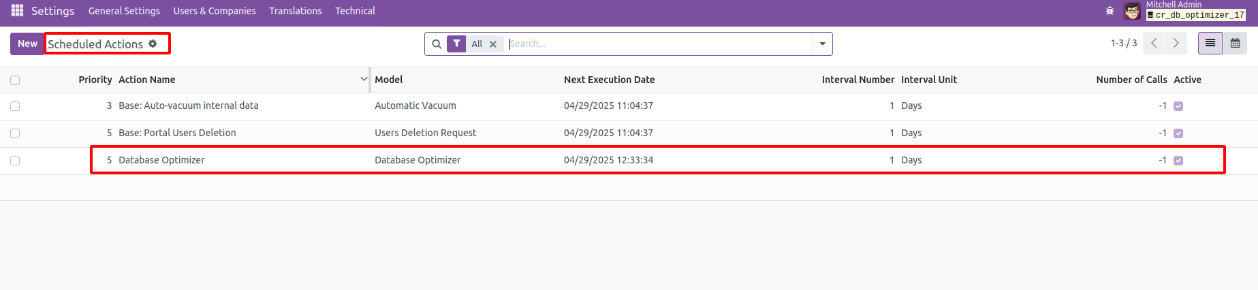
- Further in schedule actions user will see a record for Database Optimizer.
- In that particular schedule action user will see a parameter Execute Every that user need to set as per their needs.
- The parameter Next Execution Date that shows when the action will be called next & it will auto automatically set based on Execute Every set.
- Further it will automatically operate and perform the VACUUM, REINDEX, Bloated Table, Slow Queries & Checking active DB connections.
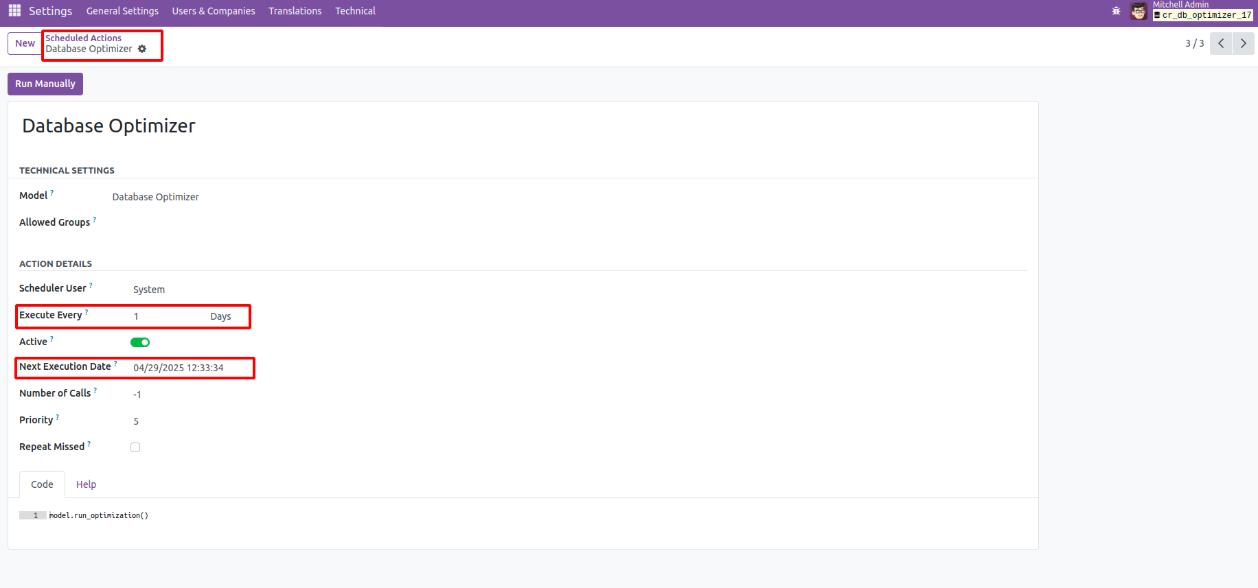
- Here user can Test the total flow process by clicking on Run Manually button & see the logs of the same.
- Later user need to navigate to Database Optimizer and there user will see records.
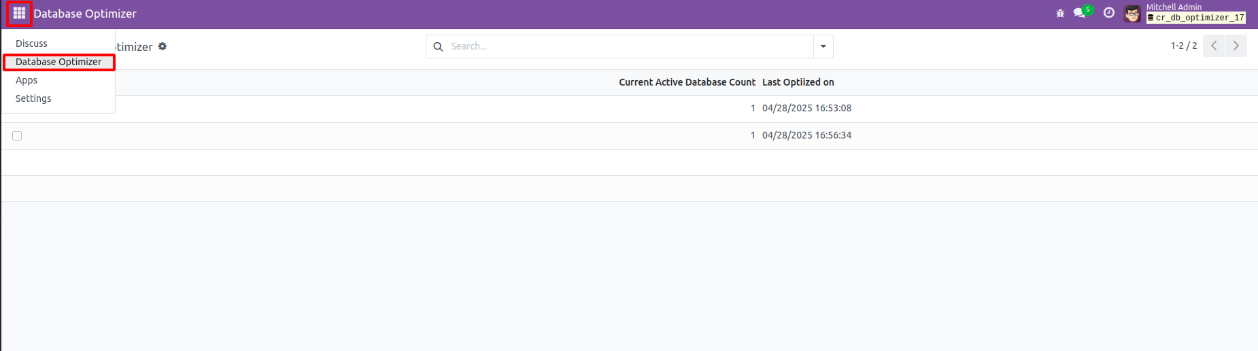
- Here opening a record user can see the Current Active Database Count, Last Optimized On & Slow Queries.